

By Daniel Mercer
Ethiopia's economy grew by an estimated 9.2% in FY2024/25, yet the country's GDP per capita still amounts to only 7% of the global average across a population of about 135.9 million. That contrast is what makes Ethiopia GDP per capita more than a statistical footnote. It is a live test of whether rapid national growth can translate into broad-based welfare gains in a populous low-income state. For G7 and G20 policymakers, that question sits at the intersection of development finance, migration pressures, food security, regional stability, and the credibility of the Sustainable Development Goals.
Headline growth can flatter. Per capita income strips away some of that optimism by asking a harder question: what does national output mean for the average citizen? In Ethiopia, the answer is mixed. The country has recorded a notable growth story from a very low base, but the size of its population and the structure of its economy mean that aggregate expansion doesn't automatically produce a commensurate rise in household prosperity. That is why nominal and purchasing power adjusted measures both matter. One shows Ethiopia's place in the global financial hierarchy. The other offers a more grounded sense of domestic living standards.
Table of Contents
- Ethiopia's Economic Paradox
- Decoding GDP Per Capita Nominal Versus PPP
- A Story of Growth Recent Trends and Historical Context
- Benchmarking Ethiopia A Regional Comparison
- Key Drivers and Headwinds Shaping the Economy
- Implications for Poverty Fiscal Policy and the SDGs
- Outlook and Recommendations for Inclusive Growth
Ethiopia's Economic Paradox
Ethiopia embodies one of development policy's hardest realities. A country can grow quickly and still remain poor in per capita terms. According to Macrotrends data on Ethiopia GDP per capita, the economy achieved an estimated 9.2% GDP growth in FY2024/25, but with a population of 135.9 million, GDP per capita still represents only 7% of the global average.
That combination matters because Ethiopia is too large, too strategically located, and too economically significant in the Horn of Africa to be treated as a niche case. If strong aggregate growth fails to raise individual welfare fast enough, pressure builds elsewhere. Governments face sharper demands for jobs, services, and social protection. Development partners confront a familiar dilemma: support a country with clear growth momentum, while recognising that scale alone won't deliver inclusion.
Why the paradox matters for global policy
For international financial institutions and G20 finance ministries, Ethiopia's trajectory has implications beyond Addis Ababa. A large low-income country that continues to expand economically can become a regional anchor if per capita gains broaden. If they don't, the same growth story can coexist with fragility, unmet expectations, and persistent poverty.
Policy signal: In Ethiopia, macroeconomic success and household welfare aren't moving at the same speed.
That's why GDP per capita deserves close attention. It forces a distinction between national output and lived economic reality. It also sharpens policy choices. External partners can't judge progress by growth rates alone. They need to ask whether growth is labour-absorbing, fiscally productive, and resilient enough to support long-term human development.
Decoding GDP Per Capita Nominal Versus PPP
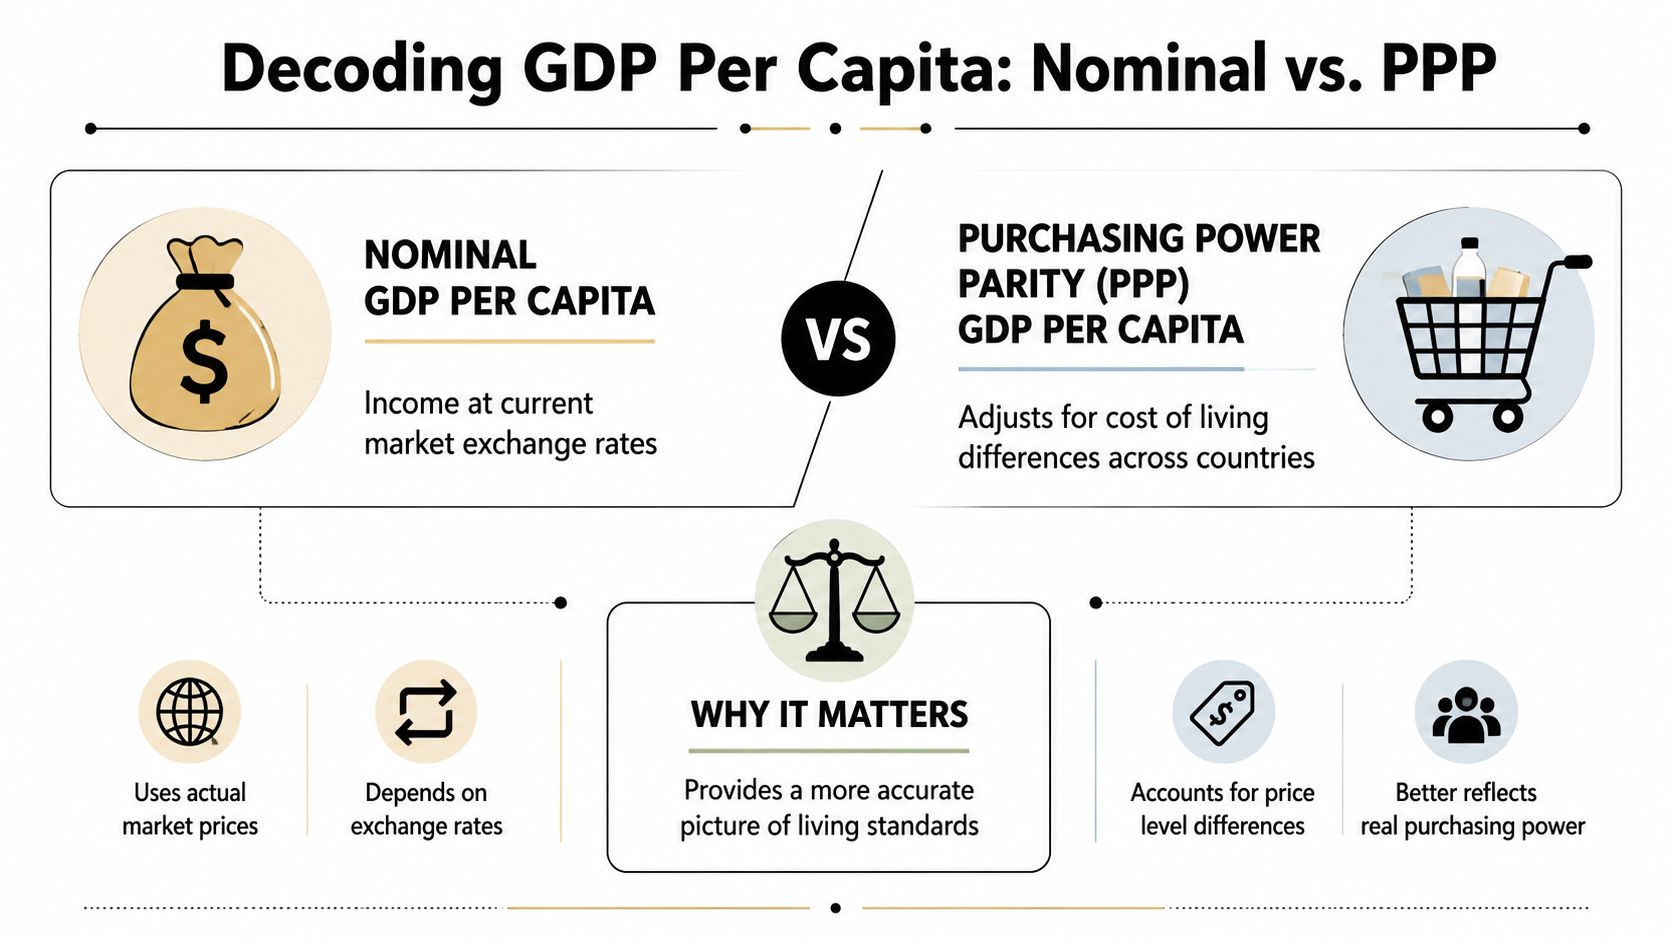
A single GDP per capita figure can mislead. Ethiopia looks much poorer when income is measured at current market exchange rates than when income is adjusted for local prices. In 2024, Ethiopia's GDP per capita was $1,134 in nominal terms but $2,884.26 on a purchasing power parity basis, according to Trading Economics data on Ethiopia GDP per capita.
What nominal income tells policymakers
Nominal GDP per capita values output using current market exchange rates. That makes it useful for comparing countries in global capital markets, assessing debt-servicing capacity in foreign currency, and understanding a country's position in international income rankings.
For Ethiopia, the nominal figure underscores constraint. It signals limited external purchasing power and a narrow margin for importing capital goods, medicines, fuel, and technology without generating foreign exchange pressure. For donors, lenders, and investors, this measure matters because many cross-border obligations are settled at market rates, not at local purchasing power.
Why PPP gives a different picture
Purchasing power parity, by contrast, asks what income can buy inside Ethiopia. Think of it as comparing not the exchange value of a birr abroad, but the size of the local basket of goods and services that income can command at home. A household may appear extremely poor in dollar terms internationally, yet still purchase more domestically than the nominal figure suggests.
A country can be cash-poor in global markets and less poor in local consumption terms. Ethiopia is a clear example.
That doesn't make Ethiopia affluent. It does mean that policymakers should avoid reading the nominal number as a full proxy for living standards. PPP is better suited to judging material welfare, while nominal measures are better for evaluating external constraints.
The practical rule for G20 audiences
Use both measures, but for different questions:
- For debt, reserves, and external financing: nominal GDP per capita is the harder test.
- For welfare and domestic consumption capacity: PPP is the more informative lens.
- For programme design: pairing both metrics prevents analytical error.
This distinction is especially important in Ethiopia GDP per capita analysis because the gap between nominal and PPP readings is large enough to alter policy conclusions. A strategy focused only on nominal income may understate domestic resilience. A strategy focused only on PPP may understate external vulnerability.
A Story of Growth Recent Trends and Historical Context
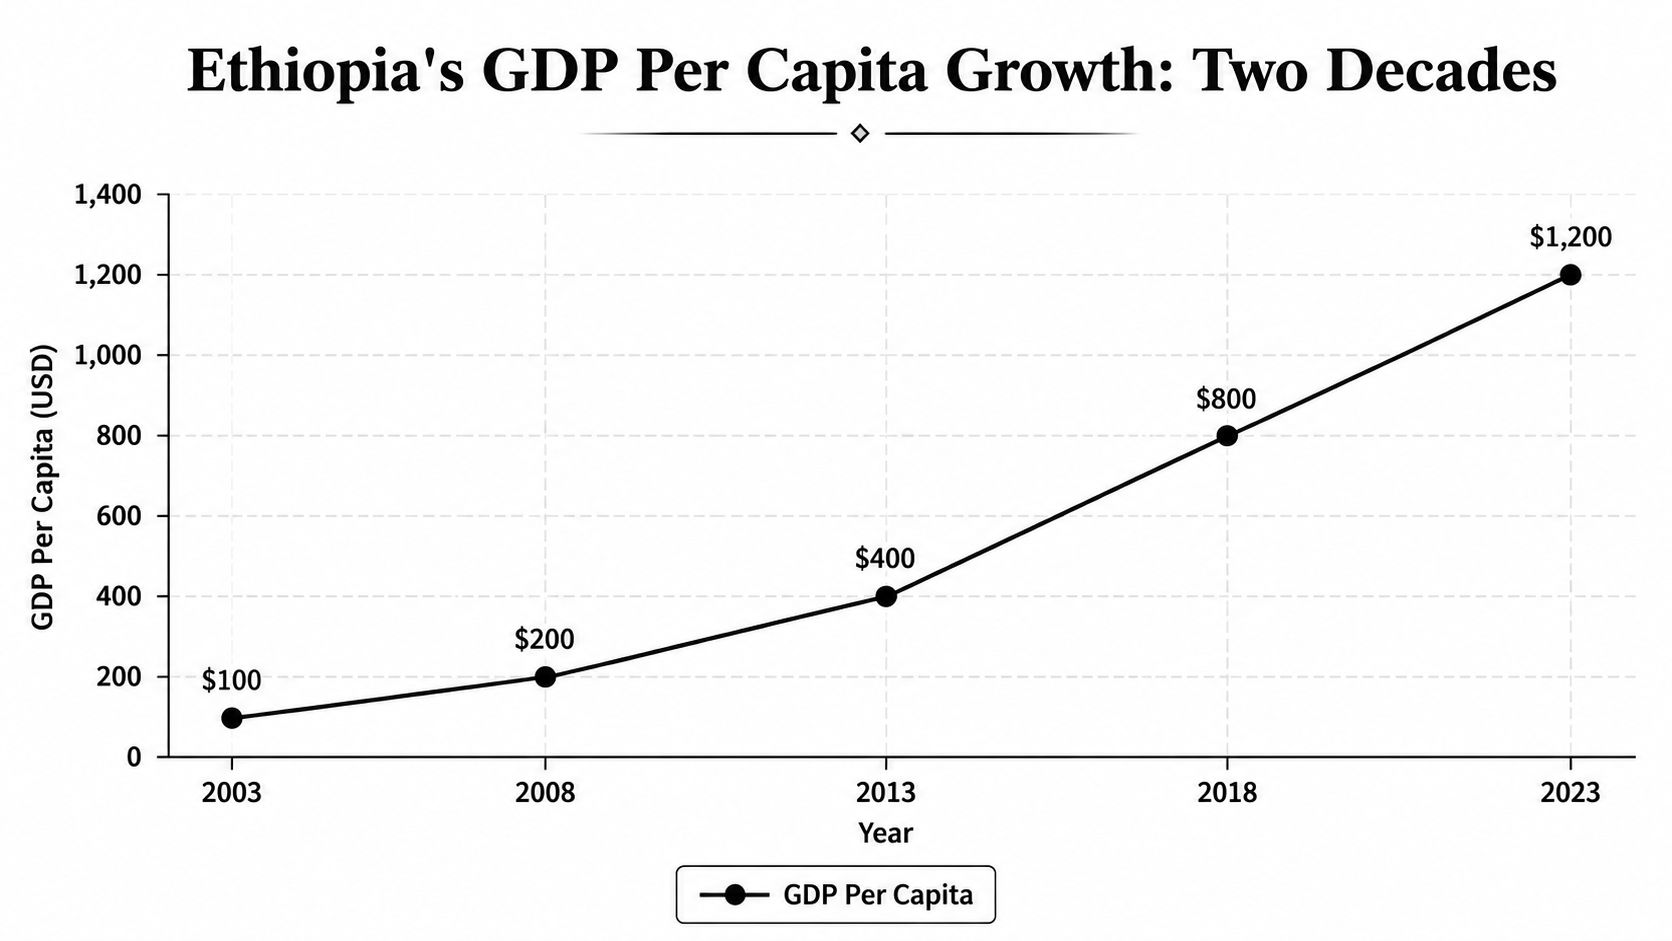
Ethiopia's long-run record is best understood as a steep climb from an exceptionally low starting point. Its nominal GDP per capita averaged $420.10 from 1981 to 2024, fell to a record low of $216.29 in 1992, and then reached $1,134 in 2024. That arc marks a major economic transformation, even if the country remains low income by global standards.
Growth from a low base
The historical lesson is straightforward. Ethiopia's current income level still looks modest because the base was so low for so long. That matters analytically. A country can post impressive percentage gains over time while remaining far from middle-income living standards in absolute terms.
Recent years reinforce the pattern. Ethiopia's nominal GDP per capita rose from $893.01 in 2021 to $1,134 in 2024. The move from $982.10 in 2022 to $1,056 in 2023 represented a 7.51% increase, followed by a rise to $1,134 in 2024, which marked a further 7.39% increase. The trend is sustained, not episodic.
Why the historical average still matters
The historical average of $420.10 is more revealing than it first appears. It shows how recent Ethiopia's income gains are. Much of the country's improvement has occurred within a relatively compressed period, which means institutions, labour markets, and public services have had to adjust rapidly.
Historical reading: Ethiopia's progress is real, but it hasn't yet had enough time or fiscal depth to erase the legacy of a very low-income past.
That helps explain why outcomes can look contradictory. Infrastructure, urban services, and market activity may expand visibly, while many households still experience precarious incomes. Policymakers should treat this not as inconsistency, but as the normal tension of structural transformation at an early stage.
What this means for interpretation
Three conclusions follow from the data:
- The improvement is substantial. Ethiopia has moved a long way from its 1992 low.
- The level is still constrained. Strong gains haven't yet produced high average incomes.
- Momentum alone isn't enough. Translating growth into durable welfare gains requires deeper structural change.
For G20 audiences, the significance is that Ethiopia isn't merely another low-income economy with stagnant output. It is a growth case with incomplete transmission from macro performance to median living standards.
Benchmarking Ethiopia A Regional Comparison
Regional benchmarking would ordinarily test whether Ethiopia is converging with neighbours such as Kenya, Sudan, or Djibouti, or with aspirational comparators beyond the Horn of Africa. But the evidence base available here does not support a numeric cross-country table for those economies. No verified regional dataset is provided for peer-country nominal income, PPP income, or annual growth in the required format. For that reason, any precise ranking against named peers would risk false accuracy.
What can still be said credibly
Ethiopia's position can still be assessed qualitatively. It is a large economy in population terms, with a growth profile that has attracted sustained attention from development partners. Yet its low per capita income means scale has not translated into the level of average prosperity associated with stronger middle-income comparators. That creates an unusual policy profile: Ethiopia has strategic weight, but limited per-person fiscal and consumption space.
The country's significance is therefore less about high income and more about its trajectory. For regional financiers and public investors, that's why institutions linked to African infrastructure and industrial upgrading remain relevant to the wider discussion, including the role of the Africa Finance Corporation in regional development finance.
A comparison table without invented numbers
| Country | Nominal GDP per Capita (USD) | PPP GDP per Capita (USD) | Annual GDP Growth (%) |
|---|---|---|---|
| Ethiopia | Verified in other sections of this briefing | Verified in other sections of this briefing | Verified in other sections of this briefing |
| Kenya | No verified comparative data provided here | No verified comparative data provided here | No verified comparative data provided here |
| Sudan | No verified comparative data provided here | No verified comparative data provided here | No verified comparative data provided here |
| Djibouti | No verified comparative data provided here | No verified comparative data provided here | No verified comparative data provided here |
This restraint is important for policymakers. Comparative analysis is only useful when it is reliable. In the absence of a validated peer dataset, the safer conclusion is strategic rather than numeric: Ethiopia should be viewed as a key low-income growth economy, not yet as a regional income leader.
Key Drivers and Headwinds Shaping the Economy
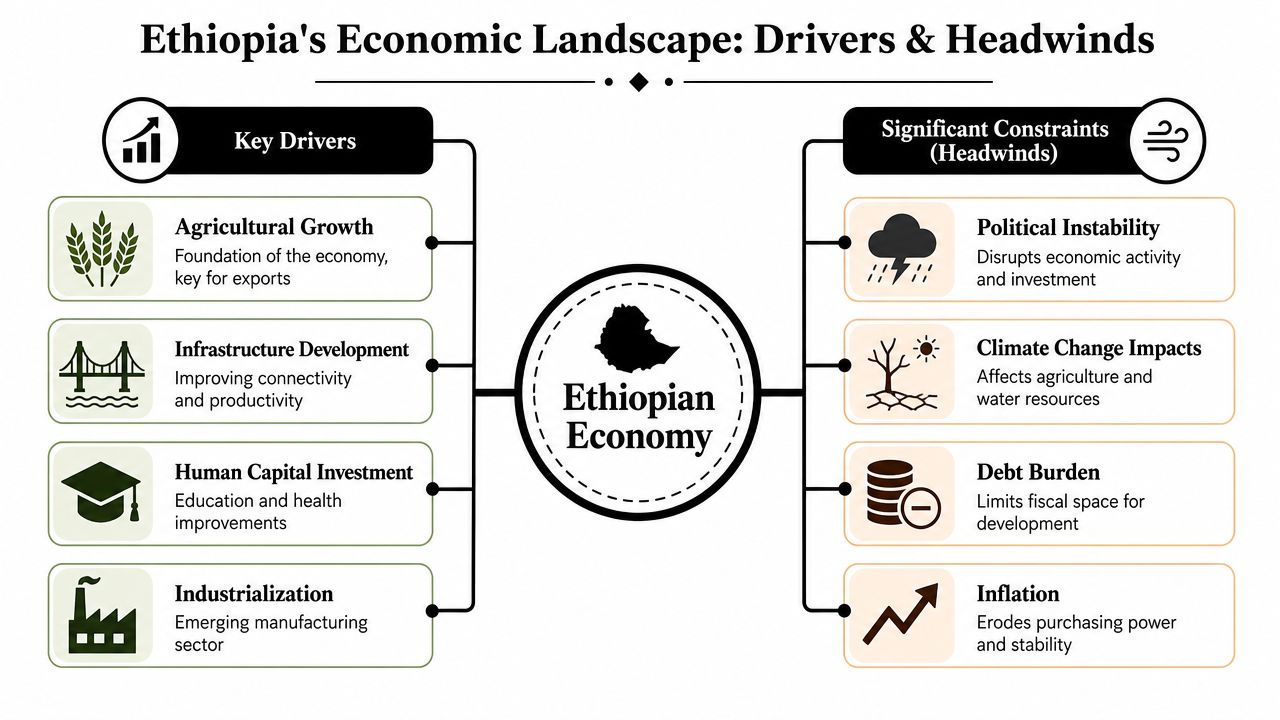
Ethiopia's GDP per capita story can't be understood without looking beneath the aggregate number. The economy's structure shows a country in transition. Agriculture accounts for 35.79% of GDP, industry 24.48%, and services 36.98% (2020 est.), indicating both diversification and continued dependence on a volatile rural base.
A transition that remains incomplete
The near balance between agriculture and services suggests movement away from a purely agrarian economy. That's encouraging. Services can support urban productivity, formalisation, and broader market integration. Industry also holds the potential to raise output per worker if investment and competitiveness deepen.
But the weight of agriculture remains decisive. It shapes income volatility, household vulnerability, and export performance. When a large share of economic activity still depends on agriculture, weather shocks, commodity fluctuations, and disruptions to rural production can carry macroeconomic consequences. That is one reason per capita progress can remain uneven even when headline growth is strong.
What drives forward movement
Several forces can plausibly support rising per capita income in this context:
- Agricultural upgrading: productivity gains in farming still matter because the sector remains systemically important.
- Services expansion: urban commerce, logistics, finance, and communications can widen the formal economy.
- Industrial deepening: manufacturing and processing could increase value added and employment quality over time.
Ethiopia's large infrastructure ambitions have also shaped the development model. Projects tied to transport, power, and water management remain central to how policymakers think about transformation, including debates surrounding major dams in Ethiopia.
The main constraints on per capita gains
The structure of the economy also reveals why GDP per capita doesn't rise as fast as aggregate output might suggest.
Broad growth is easier to achieve than broad prosperity when a large population depends on sectors with volatile productivity.
Population scale dilutes gains. External financing pressures can limit access to imports and capital goods. Inflation and exchange-rate stress can erode household purchasing power even when output expands. Political instability and climate exposure can interrupt investment, production, and confidence.
Those headwinds don't negate Ethiopia's progress. They do explain why progress remains fragile. In practice, Ethiopia's challenge isn't only to grow. It is to shift the composition of growth toward sectors and institutions that raise productivity per person, stabilise incomes, and widen fiscal capacity.
Implications for Poverty Fiscal Policy and the SDGs
Low GDP per capita has immediate policy consequences. It narrows the state's fiscal room, constrains household resilience, and complicates progress across multiple Sustainable Development Goals at once. In Ethiopia, those implications matter more because the country combines rapid aggregate growth with still-limited average income.
Poverty reduction is not automatic
When per capita income is low, many households remain one shock away from distress even during periods of growth. Food price movements, climatic events, health costs, or local job losses can quickly reverse welfare gains. That's why GDP expansion by itself won't guarantee durable poverty reduction.
Policy design has to focus on transmission channels. The critical questions are whether growth creates stable jobs, whether rural incomes rise with productivity, and whether governments can expand protection for vulnerable groups. That makes social policy central, not peripheral, to macroeconomic strategy, including the wider case for extending social protection to end poverty and hunger.
Fiscal space remains the hidden constraint
A low-income economy with a very large population faces a blunt arithmetic problem. Even when national output rises, per-person public spending can remain thin once resources are spread across education, health, infrastructure, and basic administration. For Ethiopia, this means the quality and efficiency of spending are as important as the volume.
The SDG challenge in Ethiopia isn't simply one of ambition. It is one of financing, sequencing, and delivery at scale.
That's particularly relevant for SDGs tied to poverty, hunger, education, health, gender equity, clean water, and decent work. Progress in one area often depends on financing and state capability in another. A government can't sustainably improve learning outcomes, for example, without recurrent spending capacity. It can't strengthen health resilience without procurement systems, staffing, and local service delivery.
A useful wider context is this briefing video:
Why this matters for international cooperation
For G7 and G20 actors, Ethiopia underscores a broader development truth. Countries with large populations and low per capita incomes need external engagement that supports state capability, productive employment, and risk management at the same time. Aid alone won't be enough. Nor will growth-first strategies that neglect welfare transmission. The more relevant objective is to align macro reform, investment, and social protection so that rising output lowers vulnerability.
Outlook and Recommendations for Inclusive Growth
The near-term outlook is positive in a narrow sense. Ethiopia's nominal GDP per capita is forecast to reach $1,180 in 2026, while its PPP-adjusted GDP per capita is projected at $4,974, according to the 2026 outlook summarised in the Economy of Ethiopia reference. The harder question is whether that upward movement will improve welfare broadly enough to be politically and socially durable.
What policymakers should prioritise
First, Ethiopia needs growth that raises productivity per worker, not only output in aggregate. That points to agricultural productivity, urban job creation, and more competitive industry.
Second, macroeconomic stability matters because inflation and external imbalances can cancel out nominal income gains for households. If purchasing power erodes, per capita progress becomes less meaningful in lived terms.
Third, fiscal strategy should favour investments with high social returns. Human capital, basic services, and resilient infrastructure are the channels through which a low-income growth story becomes an inclusive development story.
A final point is for external partners. International support works best when it helps countries manage transition costs while preserving reform momentum. Ethiopia doesn't need applause for growth alone. It needs a policy compact that helps convert growth into jobs, capabilities, and stability.
Global leaders tracking African development, multilateral finance, and SDG delivery can find more data-led analysis and policy briefings at Global Governance Media.