

By Alex Morgan
The most important number in sustainable development goals progress isn't a national ranking. It's the shrinking distance between today and 2030, while the policy system still behaves as if time were elastic. For G7 and G20 ministers, that changes the task. The question is no longer whether the SDGs remain a useful framework. The question is where collective action can still produce the largest marginal gains before political and fiscal constraints harden.
That requires discipline with evidence. Headline progress can mislead. Aggregate scores can hide sectoral weakness. National success in one goal can coincide with structural failure in another. Used properly, SDG data is not a communications device. It's a prioritisation tool for leaders who must decide where public finance, regulation, and international cooperation should move first.
Table of Contents
- The 2030 Agenda at a Critical Crossroads
- Decoding the SDG Measurement Framework
- Global and Regional SDG Progress A 2026 Snapshot
- A G7 Case Study The United Kingdom's SDG Journey
- Accelerating Change in a Critical Sector The Energy Transition
- Confronting Data Gaps and Hidden Deficits
- An Actionable Agenda for G7 and G20 Leaders
The 2030 Agenda at a Critical Crossroads
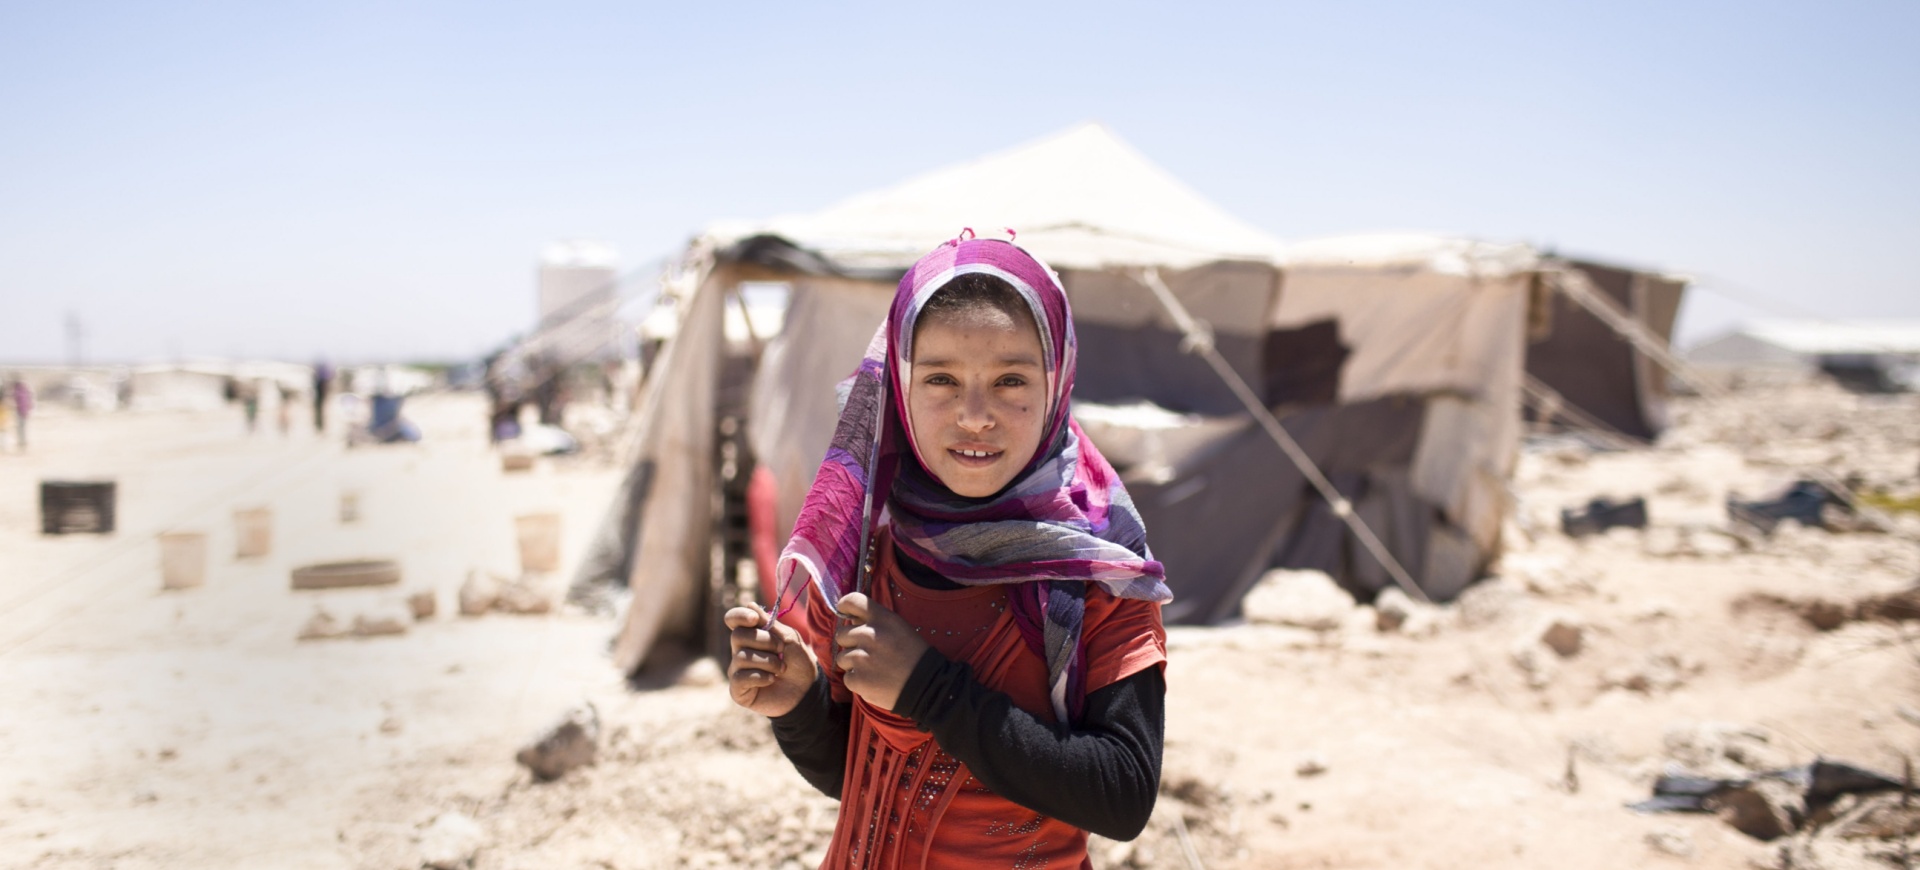
A credible reading of sustainable development goals progress starts with a hard truth. The agenda now operates under conditions of compression. Ministers aren't choosing among seventeen separate aspirations. They're managing a single integrated risk portfolio in which climate, inequality, energy, consumption, and institutional capacity interact.
That matters because the political instinct in many capitals is still to defend broad commitment while narrowing practical ambition. The SDGs can survive that rhetorically. They can't survive it operationally. If governments continue to protect easy wins and postpone structural reforms, aggregate performance may remain superficially respectable while the hardest goals continue to drift.
The strategic implication for the G7 and G20 is straightforward. They should treat SDG implementation less like a multilateral declaration and more like a cross-border investment and governance programme. That means identifying where policy choices in major economies create spillovers, where financing frameworks still reward unsustainable production, and where weak data obscures declining resilience.
Sustainable development goals progress should be judged not by how many initiatives exist, but by whether countries are closing the gap between social gains and environmental limits.
Three features define the present crossroads.
The timeline is now the constraint. Long-horizon commitments still matter, but decisions taken in the next summit cycle will shape what remains feasible before the end of the decade.
The bottlenecks are concentrated. In many advanced and emerging economies, the main problem isn't absence of policy language. It's weak execution in the sectors that carry the largest transition burdens.
The costs of delay are cumulative. When governments postpone adaptation, circular economy reform, or energy system upgrades, they don't merely slow progress. They increase the future fiscal and political cost of correction.
For G20 ministers, that's why the SDGs should be read as a map of interdependence. Consumption patterns in one market affect material demand elsewhere. Energy policy shifts alter investment signals across supply chains. Weak resilience planning in one jurisdiction can disrupt production and trade in another. The agenda's universality was always its political strength. Nearing 2030, it becomes its analytical strength too.
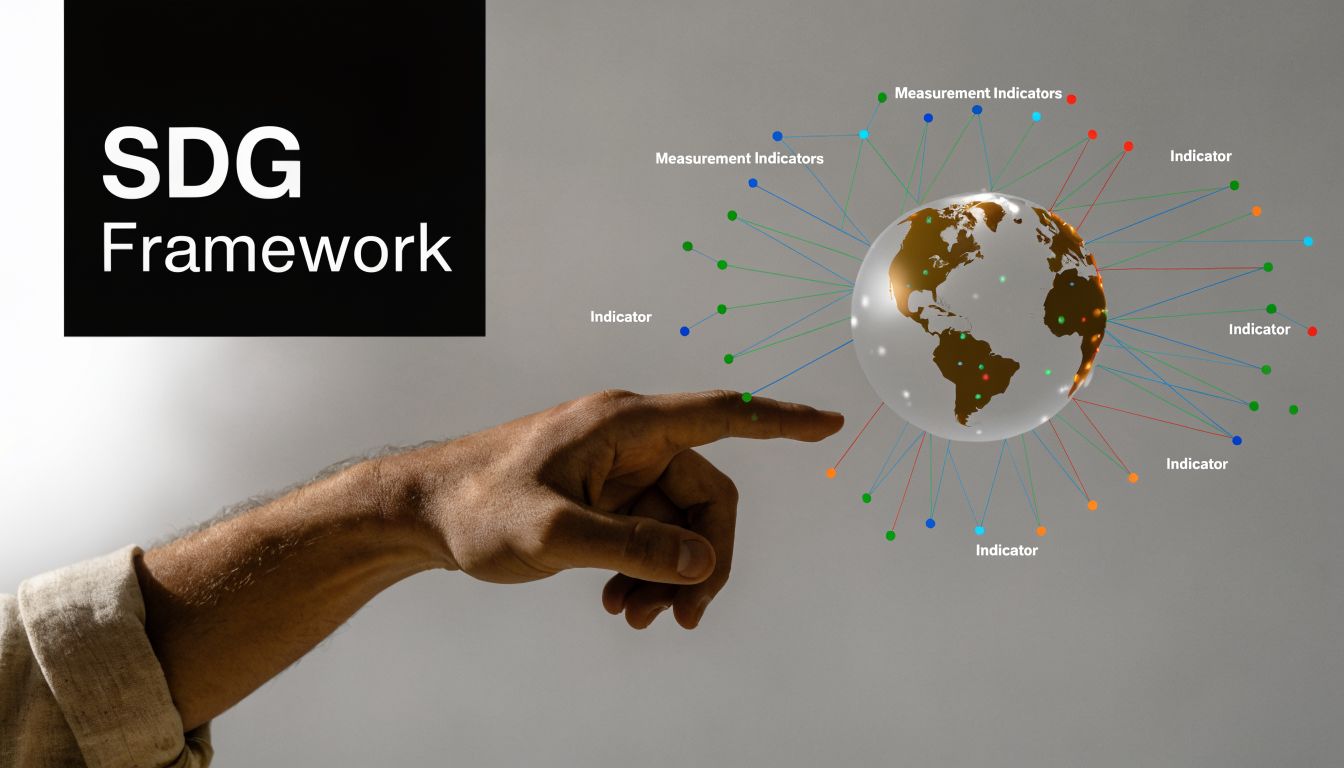
Decoding the SDG Measurement Framework
SDG measurement works best when policymakers treat it like a cabinet dashboard rather than a league table. A dashboard tells you different things at once. Some indicators show current performance. Others reveal trajectory. Others warn that one subsystem is failing even when the vehicle still appears to be moving smoothly.
Why the framework matters
The SDG architecture combines a global indicator system, national statistical production, and synthesis exercises that convert dispersed metrics into decision-useful scorecards. That combination is often misunderstood. Ministers sometimes assume an SDG score is a single empirical fact. It isn't. It's a structured interpretation built from multiple indicators with different levels of comparability, timeliness, and policy relevance.
National Statistical Offices sit at the centre of that process because they validate and organise the domestic evidence base. Multilateral institutions and analytical platforms then aggregate, standardise, and compare. The result is useful, but not simple. A strong dashboard should prompt questions, not end them.
A practical way to think about it is through three layers of evidence:
- Outcome indicators, which show where a country stands on a concrete result such as health, education, emissions, or material use.
- Trend indicators, which show whether current direction is improving, stagnating, or reversing.
- Capacity indicators, which reveal whether institutions, budgets, and delivery systems can sustain progress.
That third layer is often the most undervalued. Governments can post respectable outcomes for years while institutional capacity weakens underneath. That's why ministers should pair SDG scorecards with implementation analysis, fiscal review, and compliance monitoring. A useful companion perspective appears in this analysis of using data to improve compliance.
How ministers should read SDG data
A disciplined reading of sustainable development goals progress asks four questions.
What exactly is being measured? A score on education, energy, or climate may combine several underlying indicators rather than one direct observation.
What time period does it capture? Some indicators move quickly. Others lag because the underlying data is slow to collect and validate.
What does the score leave out? Distributional inequality, subnational disparities, ecosystem quality, and resilience can be underrepresented even when a national average looks stable.
Is the indicator policy-sensitive? Ministers need to know whether a measure responds to tools they can deploy, such as procurement rules, auctions, public investment, grid reform, or local planning.
Practical rule: Use SDG indicators to prioritise policy conversations, not to replace them.
The most effective governments don't confuse measurement with management. They use the framework to detect stress early, test whether reforms are working, and identify where one policy domain is undermining another. That's where SDG data becomes strategically valuable.
Global and Regional SDG Progress A 2026 Snapshot
The global picture is best read as a pattern of uneven motion. Some goals show visible traction. Others require improvement. Several core areas remain off track in ways that should concern both finance and foreign ministers because they touch the foundations of growth, resilience, and legitimacy.
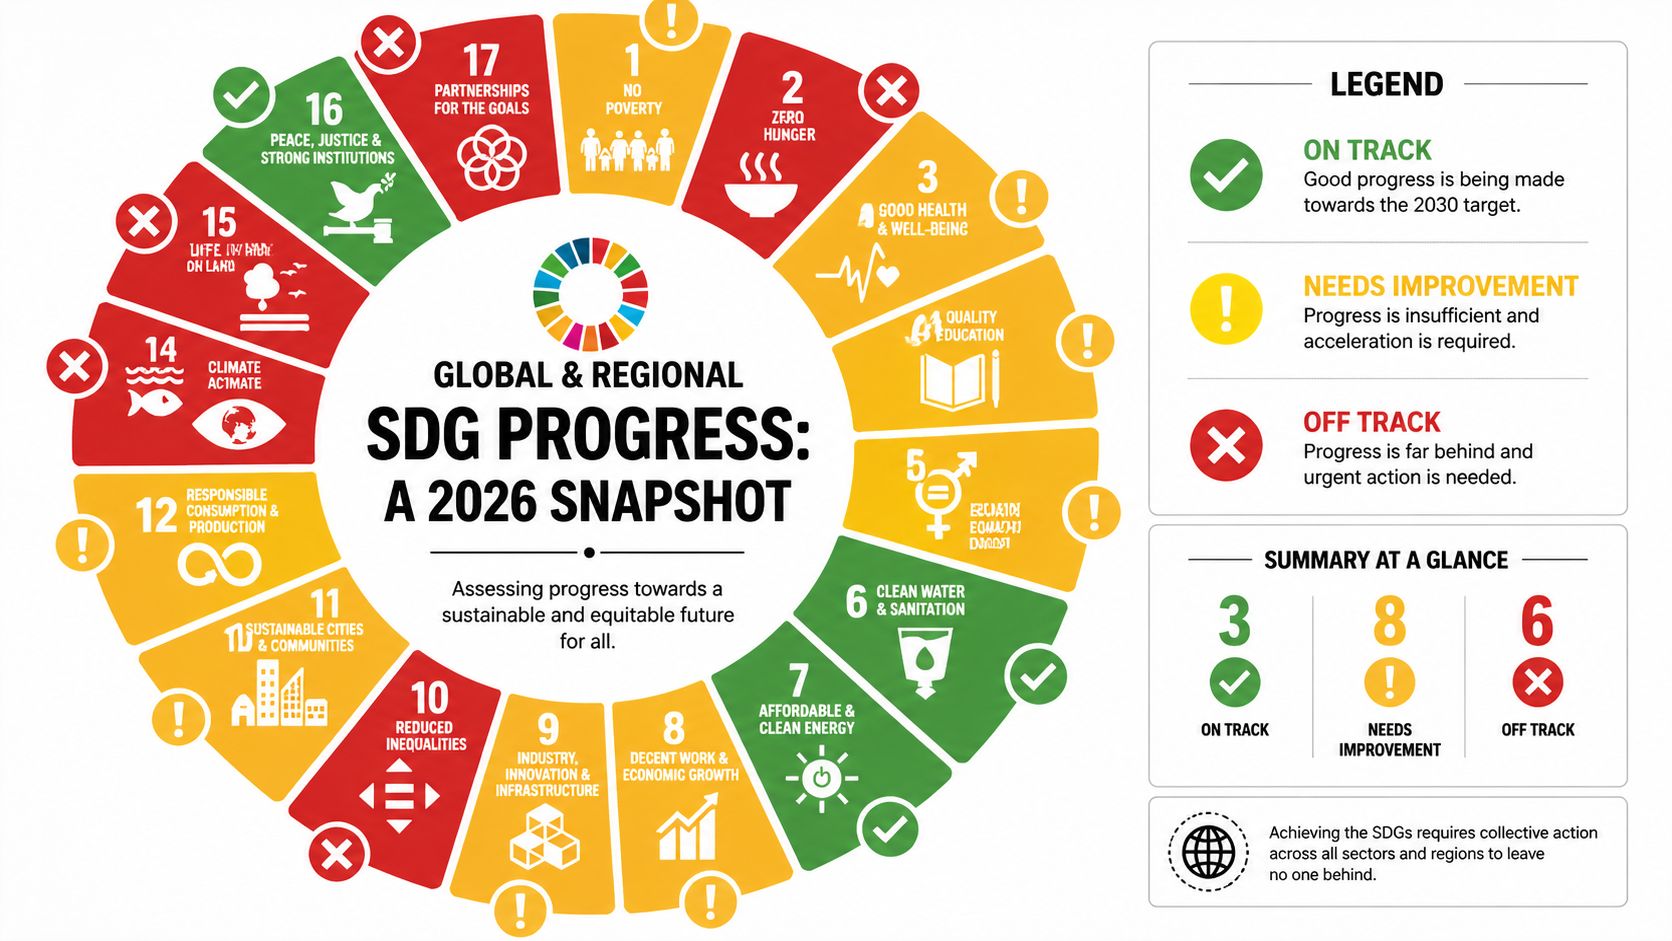
What the global dashboard is signalling
The most policy-relevant message in the current snapshot is not that progress is absent. It's that progress is selective. The infographic's division between goals that are on track, those needing improvement, and those off track reflects a recurring problem in SDG implementation. Governments are generally better at scaling goals that fit existing administrative and investment models than goals that demand changes to production systems, distribution, and ecological stewardship.
That distinction matters. Expanding services is politically and administratively different from restructuring material consumption. Improving energy deployment can proceed through bankable instruments. Reducing inequalities or restoring biodiversity requires deeper institutional bargaining and often sharper trade-offs.
A concise ministerial reading looks like this:
| SDG status | What it implies for leaders |
|---|---|
| On Track | Existing policy tools appear more mature and replicable |
| Needs Improvement | Institutions are active, but delivery is too slow or uneven |
| Off Track | Current models aren't matching the scale of the challenge |
The goals marked off track in the visual carry a common feature. They all involve strong cross-border externalities or politically difficult redistribution across sectors, territories, or generations. That is exactly where G7 and G20 coordination has the highest potential value.
Why regional interpretation matters
Regional variation shouldn't be treated as noise around a global average. It changes the policy prescription. In some settings, the problem is access and public service expansion. In others, the harder issue is decarbonising high-consumption economies without deepening social strain or offshoring environmental pressures.
The same SDG label can conceal very different policy tasks across regions. A minister looking only at the goal title will miss the implementation problem.
That is why summit processes need a dual lens. They need universal goals, but differentiated pathways. A country with advanced social infrastructure may still underperform on consumption and biodiversity. Another may make gains in basic services while lacking fiscal space for resilience. A third may build clean energy quickly but struggle with institutional trust or local delivery.
For G20 leaders, the operational takeaway is clear. Collective action should focus less on generic endorsement of the full agenda and more on targeted cooperation in domains with system-wide spillovers:
- Energy transition rules and finance
- Adaptation and resilience planning
- Sustainable production and consumption frameworks
- Data systems that improve comparability and accountability
The global snapshot doesn't support fatalism. It supports triage. That is the mindset major economies need now.
A G7 Case Study The United Kingdom's SDG Journey
The United Kingdom offers a useful case because it combines strong aggregate performance with visible structural strain. According to the Sustainable Development Report 2025 SDG Index dashboard, the United Kingdom ranks 11th globally with a score of 80.4 out of 100, while scoring above 85 points in SDG 3 and SDG 4. The same source shows a weaker result on SDG 12 at 65.7 points, with domestic material consumption per capita at 18.2 tons in 2022, compared with a sustainable threshold of 8 tons.
A strong aggregate score with clear structural warnings
That mix should look familiar to many G7 governments. The UK demonstrates that mature service systems can sustain high performance in social sectors while the underlying economic model still struggles to align with environmental limits. Good health and education scores are real achievements. They don't cancel out overconsumption of materials.
For ministers, the deeper lesson is that high-income economies often face a second-generation SDG challenge. The central question isn't whether they can deliver access. It's whether they can reduce ecological pressure without eroding political support, industrial competitiveness, or household security. That requires a different policy toolkit from the one that drove earlier gains.
A second lesson follows. Aggregate rank can create strategic complacency. An economy near the top of the table may still be poorly positioned for the next phase of SDG delivery if its weak areas are concentrated in resource use, biodiversity, or climate resilience. Those are precisely the goals with the highest long-run system risk.
High national ranking should trigger sharper diagnosis, not self-congratulation.
UK SDG Performance Snapshot 2026
| SDG | Goal Name | Score (/100) | Status |
|---|---|---|---|
| SDG 3 | Good Health and Well-being | Above 85 | Strong performance |
| SDG 4 | Quality Education | Above 85 | Strong performance |
| SDG 12 | Responsible Consumption and Production | 65.7 | Lagging |
| Overall Index | SDG Index ranking | 80.4 | 11th globally |
The UK's profile yields two transferable insights for G20 decision-makers.
First, social progress and environmental stress can coexist for long periods. If ministers assess sustainable development goals progress only through social outcomes, they may underestimate transition risk.
Second, consumption-based pressures deserve more political attention. Production-side decarbonisation and service-sector performance are necessary, but they won't by themselves resolve the material footprint challenge embedded in advanced economies.
That is why a serious G7 agenda can't stop at celebrating progress in health, education, or clean power. It has to confront how prosperity is produced and consumed.
Accelerating Change in a Critical Sector The Energy Transition
The strongest current example of policy-linked SDG acceleration in the UK sits in energy. According to the UNECE SDG 2025 technical notes, 40.2% of UK electricity came from renewables in 2024, up from 26.8% in 2015, and that acceleration is linked to the Contracts for Difference scheme, which helped de-risk investment and enabled 14 GW of offshore wind capacity by 2024.
Policy design that changed investment behaviour
It offers more than a success story. It shows a mechanism. The UK didn't improve SDG 7 through aspiration alone. It used a policy instrument that altered risk allocation between the state and private investors. Once investors could model revenue certainty more credibly, deployment followed.
That sequence should interest every G20 energy minister. In sectors with high upfront capital needs and policy uncertainty, the decisive variable is often not technology readiness but investment confidence. CfDs addressed that bottleneck directly.
Three features make the lesson portable.
- Revenue certainty mattered more than rhetorical commitment. Investors respond to stable rules more reliably than to broad net-zero signalling.
- Sector-specific design outperformed generic subsidy logic. The instrument matched the economics of deployment.
- Public policy shaped market timing. Governments didn't replace private capital. They made it investable.
For broader context on how this fits into international transition debates, this related analysis on the global energy transition is useful.
What other G20 economies can adapt
Not every country can copy the UK model line for line. Power market design, grid conditions, fiscal constraints, and industrial strategies differ. But the strategic principles travel well. Governments need durable procurement frameworks, regulatory clarity, and institutions capable of translating climate ambition into financeable projects.
A second point is often missed. Energy transition progress should be judged not only by installed assets but by how effectively policy creates repeatability. One successful auction matters less than a system that can keep attracting capital under changing macroeconomic conditions.
A useful illustration of the sector's practical dimension appears below.
For G7 and G20 leaders, the energy lesson is not just "invest more". It is design better markets. Where governments create credible rules, private capital scales. Where they don't, transition plans remain declaratory and sustainable development goals progress slows even when technologies are available.
Confronting Data Gaps and Hidden Deficits
Climate indicators often produce the clearest example of why ministers must look beneath the headline. According to the UN SDG reporting reference for 2025, UK emissions fell 47% from their 1990 baseline by 2024. The same source reports that only 62% of local authorities have heat risk plans, while the adaptation budget averaged £0.7bn per year from 2021 to 2024 against an estimated need of £5bn annually.
Mitigation success doesn't equal resilience
That is not a contradiction. It is a warning. A country can post substantial emissions reductions and still remain underprepared for the physical impacts of climate change. If ministers read SDG 13 mainly through mitigation, they risk mistaking partial progress for system readiness.
The analytical error is common because mitigation is easier to count and communicate. Emissions trajectories lend themselves to dashboards, targets, and international comparison. Adaptation is more fragmented. It depends on local planning, infrastructure condition, fiscal continuity, emergency coordination, and institutional capability. Those variables are harder to compress into one headline figure.
A falling emissions line doesn't tell a flood-prone city whether its residents are safer.
Three hidden deficits ministers should track
The UK example highlights three deficits that can remain concealed inside otherwise positive narratives.
The planning deficit. If local authorities lack heat risk plans, national climate ambition may not translate into community protection.
The budget deficit. When adaptation allocations remain well below assessed need, governments accumulate future liabilities even while reporting present progress.
The measurement deficit. National aggregates can obscure uneven preparedness across places, sectors, and vulnerable groups.
Sustainable development goals progress needs a more mature reading. Ministers should ask not only whether emissions are falling, but whether institutions can absorb shocks, whether local systems are equipped to act, and whether budget patterns match stated priorities.
A stronger resilience lens would also improve cross-government coordination. Finance ministries would see adaptation as risk management rather than discretionary spending. Interior ministries would connect resilience to civil protection. Infrastructure ministries would align standards, maintenance, and climate exposure. Once framed that way, adaptation stops being an adjunct to climate policy and becomes part of economic governance.
An Actionable Agenda for G7 and G20 Leaders
The evidence points to a narrow but still meaningful agenda for collective action. The largest economies won't rescue sustainable development goals progress through broader declarations. They can still shift trajectory if they focus on the policy domains where multilateral coordination changes incentives, lowers risk, and improves implementation quality.
First focus on system spillovers
The first priority is energy market design and transition finance. The SDG 7 example shows that credible policy frameworks can move capital at scale. G7 and G20 leaders should concentrate on instruments that improve investment certainty, accelerate grid-compatible deployment, and lower the cost of clean infrastructure in both advanced and emerging economies.
The second priority is adaptation as core economic policy. The climate data discussed earlier shows why this can't remain secondary. Emissions reduction is indispensable, but resilience deficits are now a direct threat to growth, fiscal stability, and social cohesion. Ministers should raise adaptation planning, budget alignment, and local delivery systems into the centre of summit communiqués and follow-up processes.
A third priority is consumption and material efficiency. The UK case demonstrates that strong social scores can coexist with unsustainable resource use. G20 governments need more coordinated approaches to circular economy policy, product standards, procurement, and industrial incentives so that decarbonisation doesn't leave material demand untouched.
Then build a sharper delivery compact
Those substantive priorities need an operating model. Four actions stand out.
Create tighter ministerial accountability. Summit commitments should be attached to named institutions, delivery timelines, and sector-specific reporting rather than broad endorsement language.
Invest in better SDG data infrastructure. Where indicators are weak on resilience, subnational inequality, or ecological pressure, governments should strengthen the statistical and administrative systems that produce policy-useful evidence.
Reward policy transfer, not just policy announcement. Leaders should identify instruments that have demonstrably changed behaviour, then support adaptation in other national settings rather than repeatedly negotiating generic principles.
Treat trade-offs explicitly. The SDGs were never designed for cherry-picking. Ministers need decision processes that surface tensions early, especially where industrial, social, and environmental objectives collide.
One useful entry point for that wider discussion is this analysis of how the G20 can help rescue the SDGs.
The central conclusion is sharper than the usual summit language. The world doesn't lack an SDG framework. It lacks concentrated implementation in the goals where politics is hardest and spillovers are largest. G7 and G20 leaders still have the tools to change that. What they don't have is time for another cycle of broad commitment without policy precision.
Global cooperation works best when decision-makers can see where the evidence points and what action follows from it. For more data-led analysis, summit briefings, and practical multilateral insights, follow Global Governance Media.